Flux observations over an urban center in Sakai
PI. Masahito UEYAMA
Research background
To accurately estimate global energy, water and carbon exchange, long-term monitoring of those fluxes has been conducted at many terrestrial ecosystems. However, it is still uncertain in the exchange processes in urban landscape due to lack of continuous measurement. In this study, we have conducted the long-term observations of those fluxes in an urban center, to evaluate 1) diurnal, seasonal, and interannual variation of the fluxes, and 2) important processes related to the fluxes.
Field observations
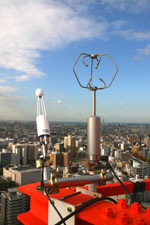
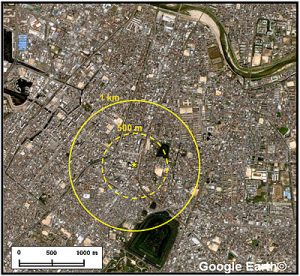
The measurements were conducted at a city center of Sakai (34o34’25’’N, 135o28’80’’E), where the area is densely built-up; an industrial and commercial center with heavy traffic since winter in 2008. The measurement height is above the blending height, 112 m above ground. Sakai is a second biggest city in Osaka, and a city designated by ordinance. The population exceeds 800,000.
| Environmental Variables | Method | Site |
| Momentum, sensible heat, and latent heat fluxes | Eddy covariance |
SAC, OPU, IZM |
| CO2 flux | Eddy covariance | SAC, OPU, IZM |
| air temperature and humidity | Ventilated sensors | SAC, OPU, IZM |
| solar radiation | Pyrheliometer | SAC, OPU, IZM |
| Four components of net radiation | Component Net Radiometer | OPU |
| surface temperature | radiation thermometer | SAC, OPU, IZM |
| rainfall | rain gauge | OPU |
| ground heat flux | heat plate | OPU |
| evaporation | method of weighing | OPU |
| vertical CO2 profile | 4 heights | SAC |
* SAC : Sakai City Office
* OPU : root top of Osaka Prefecture University
* IZM : Oizumi Urban park
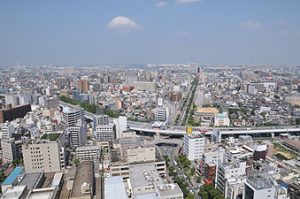
Fig. Eddy covariance system over the urban canopy
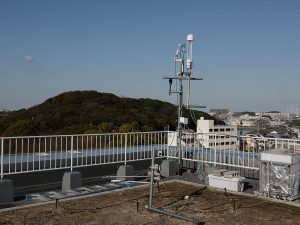
Observation at the roof top of Osaka Prefecture University
To compare the fluxes between the urban center and a surrounding location, we set up another observation system, including closed path eddy covariance system.
Fig. observations at the roof top of OPU
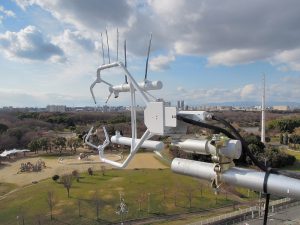
Fig. observations at Oizumi Urban park.
Fig. An aerial photograph showing our observation point at Sakai Center
Data availability
Observed data can be downloaded from following link.
References
Ueyama, M., Mitake, Y., Yamaguchi, K. and Hamotani, K., 2011: Micrometeorological measurements of heat, water, and CO2exchanges at an urban landscape in Sakai, Japan. AsiaFlux Newsletter, 32, 9-12.


